MATLAB源代码:
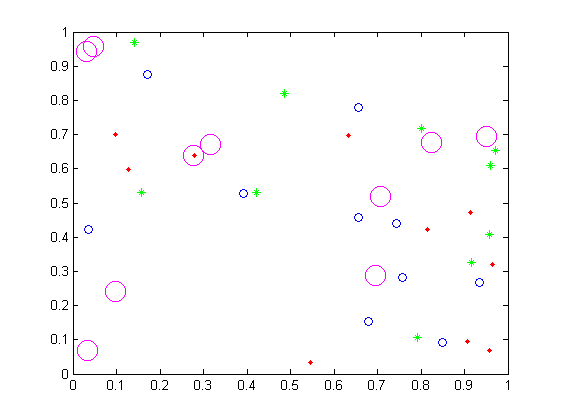
1.绘制散点图
[cc lang=”matlab”]
clear all;
clc;
x=rand(10,1,40); % 随机取40个数 一个当横坐标 一个当纵坐标
y=rand(10,1,40);
%画图
plot(x( 1:10),y( 1:10),’r.’);hold on; % 点 r=红色
plot(x(11:20),y(11:20),’g*’);hold on; % 星星 g=绿色
plot(x(21:30),y(21:30),’o’);hold on; % 圆圈 默认是蓝色
plot(x(31:40),y(31:40),’mo’,’MarkerSize’,15) % 大大的圆圈 m=紫色
%还可以用函数scatter(二维)或者scatter3(三维)
[/cc]
图像:
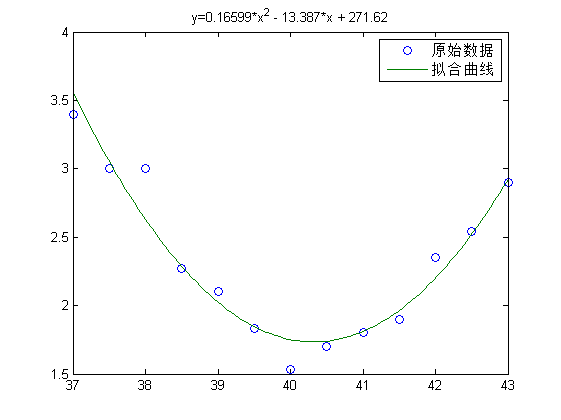
2.由散点拟合曲线
[cc lang=”matlab”]
figure;
x=[37 37.5 38 38.5 39 39.5 40 40.5 41 41.5 42 42.5 43];
y=[3.4 3 3 2.27 2.1 1.83 1.53 1.7 1.8 1.9 2.35 2.54 2.9];
p=polyfit(x,y,2); % 拟合出的二次函数的系数
ye=y-polyval(p,x); % 计算误差
ye2s=sum(ye.^2); % 误差的平方和
disp(sprintf(‘误差的平方和=%d’,ye2s));
xx=linspace(min(x),max(x)); % 绘图用到的点的横坐标
yy=polyval(p,xx); % 拟合曲线的纵坐标
plot(x,y,’o’,xx,yy); % 绘图,原始数据+拟合曲线
legend(‘原始数据’,’拟合曲线’); % 图示
s=char(vpa(poly2sym(p,’x’),5)); % 二次函数式转换为字符串,vpa转换小数,保留5位有效数字
title([‘y=’ s]);
[/cc]
图像:
附录:
scatter和scatter3的帮助文件:
help scatter:
SCATTER Scatter/bubble plot.
SCATTER(X,Y,S,C) displays colored circles at the locations specified
by the vectors X and Y (which must be the same size).
S determines the area of each marker (in points^2). S can be a
vector the same length a X and Y or a scalar. If S is a scalar,
MATLAB draws all the markers the same size. If S is empty, the
default size is used.
C determines the colors of the markers. When C is a vector the
same length as X and Y, the values in C are linearly mapped
to the colors in the current colormap. When C is a
length(X)-by-3 matrix, it directly specifies the colors of the
markers as RGB values. C can also be a color string. See ColorSpec.
SCATTER(X,Y) draws the markers in the default size and color.
SCATTER(X,Y,S) draws the markers at the specified sizes (S)
with a single color. This type of graph is also known as
a bubble plot.
SCATTER(…,M) uses the marker M instead of ‘o’.
SCATTER(…,’filled’) fills the markers.
SCATTER(AX,…) plots into AX instead of GCA.
H = SCATTER(…) returns handles to the scatter objects created.
Use PLOT for single color, single marker size scatter plots.
Example
load seamount
scatter(x,y,5,z)
See also scatter3, plot, plotmatrix.
Reference page in Help browser
doc scatter
help scatter3:
SCATTER3 3-D Scatter plot.
SCATTER3(X,Y,Z,S,C) displays colored circles at the locations
specified by the vectors X,Y,Z (which must all be the same size). The
area of each marker is determined by the values in the vector S (in
points^2) and the colors of each marker are based on the values in C. S
can be a scalar, in which case all the markers are drawn the same
size, or a vector the same length as X,Y, and Z.
When C is a vector the same length as X,Y, and Z, the values in C
are linearly mapped to the colors in the current colormap.
When C is a LENGTH(X)-by-3 matrix, the values in C specify the
colors of the markers as RGB values. C can also be a color string.
SCATTER3(X,Y,Z) draws the markers with the default size and color.
SCATTER3(X,Y,Z,S) draws the markers with a single color.
SCATTER3(…,M) uses the marker M instead of ‘o’.
SCATTER3(…,’filled’) fills the markers.
SCATTER3(AX,…) plots into AX instead of GCA.
H = SCATTER3(…) returns handles to scatter objects created.
Use PLOT3 for single color, single marker size 3-D scatter plots.
Example
[x,y,z] = sphere(16);
X = [x(:)*.5 x(:)*.75 x(:)];
Y = [y(:)*.5 y(:)*.75 y(:)];
Z = [z(:)*.5 z(:)*.75 z(:)];
S = repmat([1 .75 .5]*10,numel(x),1);
C = repmat([1 2 3],numel(x),1);
scatter3(X(:),Y(:),Z(:),S(:),C(:),’filled’), view(-60,60)
See also scatter, plot3.
Reference page in Help browser
doc scatter3